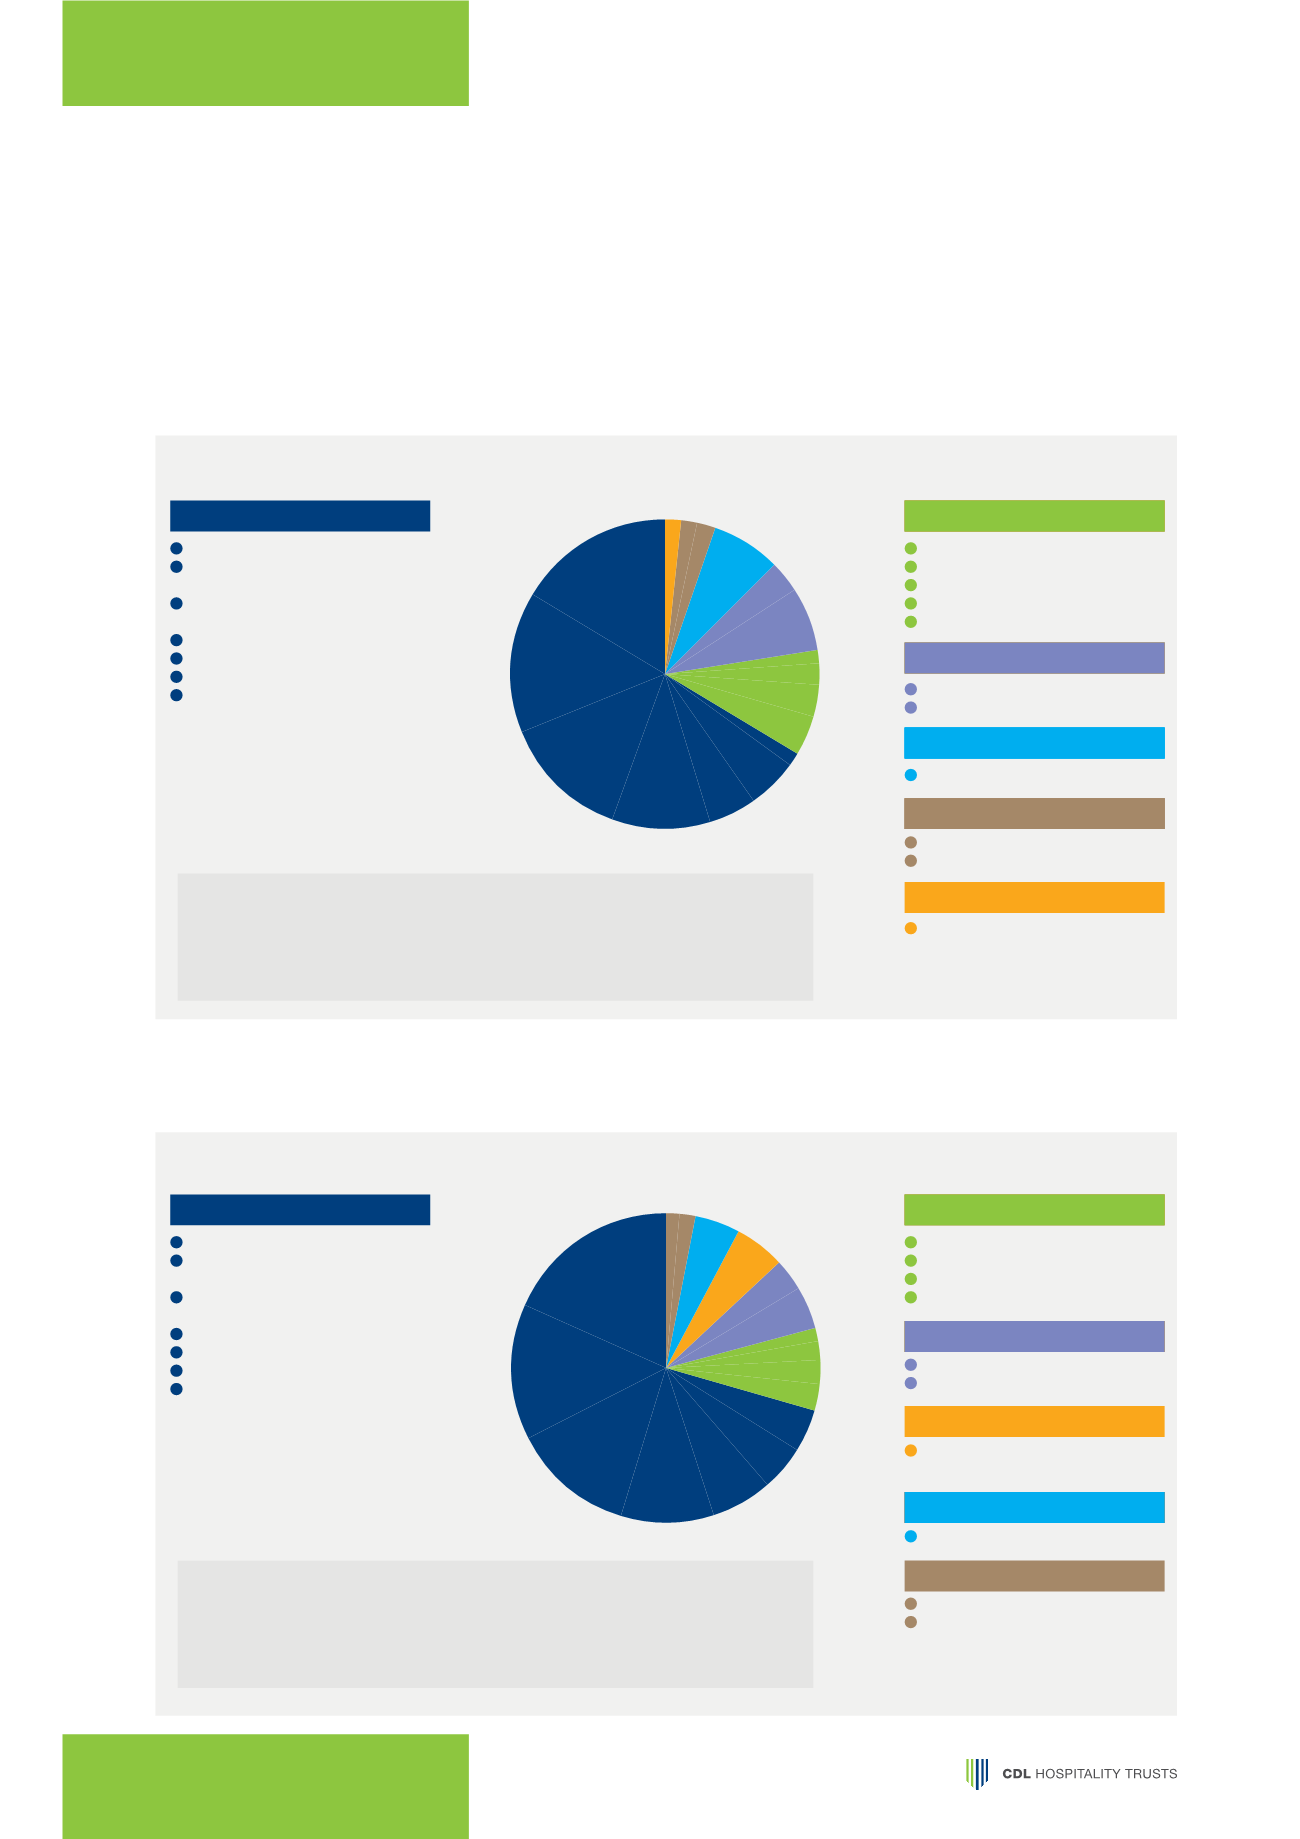
Singapore
66.4%
Orchard Hotel
16.1%
Novotel Singapore
14.8%
Clarke Quay
Grand Copthorne
13.4%
Waterfront Hotel
M Hotel
10.1%
Studio M Hotel
5.2%
Copthorne King’s Hotel
5.1%
Claymore Connect
1.6%
SINGAPORE PORTFOLIO
66.4%
OVERSEAS PORTFOLIO
33.6%
Australia
11.1%
Novotel Brisbane
4.0%
Mercure Brisbane
2.0%
Ibis Brisbane
1.3%
Mercure Perth
2.3%
Ibis Perth
1.5%
Maldives
10.0%
Angsana Velavaru
6.6%
Jumeirah Dhevanafushi
3.3%
New Zealand
7.1%
Rendezvous Hotel Auckland 7.1%
Japan
(1)
3.8%
MyStays Asakusabashi
2.1%
MyStays Kamata
1.7%
United Kingdom
(2)
1.7%
Hilton Cambridge
1.7%
City Centre
(1) Acquisition of the Japan Hotels was completed on 19 December 2014. Contribution
from the Japan Hotels for FY 2015 includes the last 13 days of FY 2014.
(2) Acquisition of the UK Hotel was completed on 1 October 2015, hence NPI of UK
Hotel only includes 3 months of contribution.
Note: Percentages may not add up due to rounding.
Singapore
70.5%
Orchard Hotel
18.2%
Grand Copthorne
14.2%
Waterfront Hotel
Novotel Singapore
12.9%
Clarke Quay
M Hotel
9.5%
Studio M Hotel
6.4%
Copthorne King’s Hotel
4.9%
Claymore Connect
4.3%
SINGAPORE PORTFOLIO
70.5%
OVERSEAS PORTFOLIO
29.5%
Australia
8.6%
Novotel Brisbane
2.8%
Mercure & Ibis Brisbane 2.6%
Mercure Perth
1.9%
Ibis Perth
1.3%
Maldives
7.7%
Angsana Velavaru
4.5%
Jumeirah Dhevanafushi
3.3%
United Kingdom
5.4%
Hilton Cambridge
5.4%
City Centre
New Zealand
4.6%
Rendezvous Hotel Auckland 4.6%
Japan
3.2%
MyStays Asakusabashi
1.8%
MyStays Kamata
1.5%
(1) All properties, excluding the UK Hotel, were valued as at 31 December 2015.
The UK Hotel, which was acquired on 1 October 2015, was valued by Knight Frank
LLP as at 25 August 2015.
Note: Percentages may not add up due to rounding.
NET PROPERTY INCOME
S$
137.0 MILLION
PORTFOLIO VALUATION
S$
2.5 BILLION
PORTFOLIO SUMMARY
OF CDL HOSPITALITY TRUSTS
OVERVIEW AND FINANCIAL REVIEW
NET PROPERTY INCOME BY GEOGRAPHY AND PROPERTIES
(1) (2)
For FY 2015
PORTFOLIO VALUATION BY GEOGRAPHY AND PROPERTIES
(1)
As at 31 December 2015
16


